
Inflation Calculator
Compare a dollar amount across historical annual-average CPI-U data from 1970 through 2025, or explore a future purchasing-power scenario using a rate you enter.
Purchasing Power Over Time
How This Is Calculated
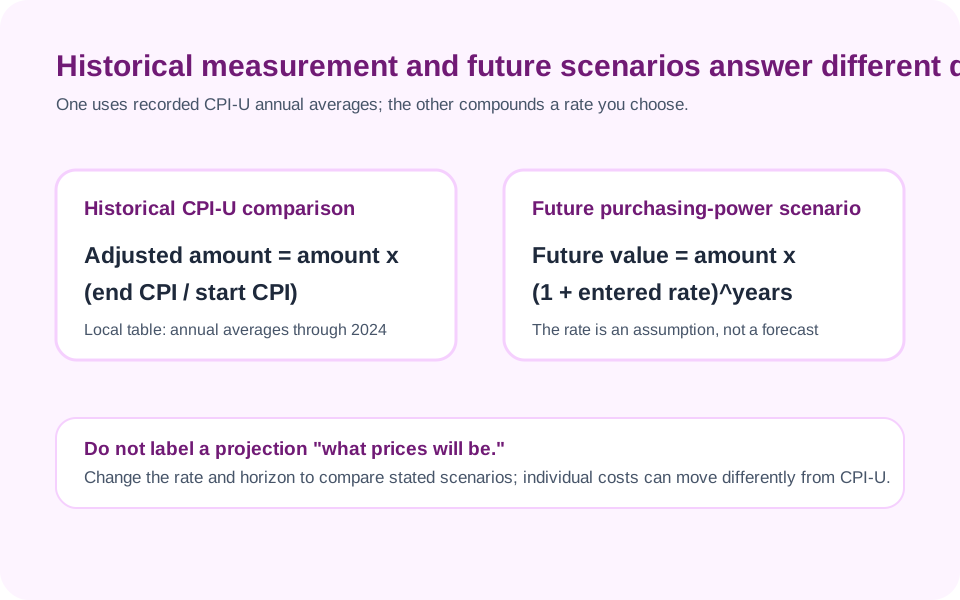
Historical mode uses the CPI ratio: amount multiplied by end-year CPI divided by start-year CPI. Future mode projects at your rate both ways: amount times (1 + rate) to the power of years, and amount divided by the same factor.
Check the method before you use the estimate
This page documents the formula, assumptions, and any specific external sources used for this tool.
See the methodPlanning estimate What this result can and cannot tell you
This calculator is an educational index comparison and scenario tool, not financial advice, tax advice, legal advice, credit advice, investment advice, retirement advice, or purchasing advice. Historical CPI and an entered future rate cannot predict your personal costs or returns.
How the Inflation Calculator works
These notes describe the calculation used on this page and the assumptions that can change a real-world result.
Historical adjusted amount = entered amount x (end-year CPI-U / start-year CPI-U). Cumulative change = (end-year CPI-U / start-year CPI-U - 1) x 100. Future nominal amount = entered amount x (1 + entered rate)^years; future purchasing power = entered amount / (1 + entered rate)^years.
Assumptions on this page
- Historical mode uses annual-average US CPI-U values in the calculator data from 1970 through 2025, not a live monthly series and not data after 2025.
- CPI-U is an index for a defined consumer basket; it may not match a particular household, city, product, investment, tax situation, or wage arrangement.
- Future mode does not forecast inflation. It compounds the rate and number of years entered by the visitor.
Sources used on this page
- US Bureau of Labor Statistics: CPI-U annual average, U.S. city average Used to check the annual-average CPI-U history through 2025, including the 2025 annual-average value of 321.943 represented in the calculator data.
- US Bureau of Labor Statistics: Consumer Price Index Linked for the official CPI program context and releases; this page does not automatically import a live CPI reading.
Everything behind the Inflation Calculator
Formulas, reference charts, and detailed answers — expand any section you need.
Two modes answer different questions
Historical mode asks how an amount changes when it is expressed using two annual-average Consumer Price Index for All Urban Consumers (CPI-U) observations. The calculator's local historical data runs from 1970 through 2025. It does not treat 2025 as a live “today” value and it does not invent values for later years. Future mode asks a different question: what would happen if the rate and time period entered by the visitor occurred? That result is a compound-rate scenario, not an inflation forecast.
Keeping the modes separate prevents a common mistake. A historical CPI ratio describes an index change that already occurred. It does not tell us what a future rate will be. A future scenario can be useful for stress-testing a budget or target, but it should be labeled with its entered rate and revisited when circumstances change. For a salary conversion before considering price changes, use the Salary Calculator.
How historical CPI-U conversion works
The historical calculation is a ratio. Divide the end-year CPI-U by the start-year CPI-U, then multiply the dollar amount by that ratio. The same ratio gives the cumulative index change. To display an annualized rate over multiple years, the calculator takes the ratio to the power of one divided by the years and subtracts one.
For a reproducible example, the local data lists CPI-U annual averages of 258.811 for 2020 and 321.943 for 2025. A $1,000 amount multiplied by 321.943 divided by 258.811 equals about $1,243.93. That is a 24.39% cumulative index increase over the five-year span, or roughly 4.46% annualized by the calculator's formula. It is an index comparison, not a statement that every item or household expense rose by that amount.
What CPI-U can and cannot represent
CPI-U is a broad US consumer-price index. It is designed to measure the change over time in prices paid by urban consumers for a defined basket of goods and services. It is not a personal receipt tracker. A renter, homeowner, student, retiree, commuter, or family with medical expenses can experience changes that differ from the index because their spending mix differs from the CPI basket.
That distinction matters for planning. Use CPI-U to make a consistent public historical comparison, then supplement it with actual recurring expenses when assessing a household budget. A single national index also cannot settle a local rent increase, a specific healthcare premium, a college cost, or the purchasing power of an investment account. The Bureau of Labor Statistics CPI program provides the official context for the series.
Future mode compounds an assumption you choose
Future mode uses two sides of the same equation. A $10,000 amount growing at an entered 3% annual rate for 10 years becomes about $13,439.16 in nominal dollars. Conversely, $10,000 held without growth would have purchasing power of about $7,440.94 in today's-dollar terms under that same 3% assumption. These values are arithmetic consequences of 1.03 raised to the tenth power; they are not predictions about future CPI, wages, interest, or investment returns.
Try a range rather than trusting one input. A 2%, 3%, and 4% scenario can show how sensitive a distant goal is to an assumption. If you use the result for a retirement target, record whether the target is nominal or expressed in current purchasing-power terms. The Retirement Calculator and 401(k) Calculator use their own assumptions, so do not combine outputs without checking their timing and inflation treatment.
Compare prices and salaries with the same base year
A price comparison is clearest when all figures are translated to one selected year using the same CPI-U series. For example, a past salary and a current salary can be compared after the past salary is converted into the current data year. But a higher CPI-adjusted salary does not automatically mean a better financial position: taxes, benefits, hours, commuting, housing, debt, and geographic costs can all change the comparison.
For a product price, distinguish quality changes from price changes. A smaller package, a different service tier, or a new fee can prevent a direct like-for-like comparison even when a CPI conversion is calculated correctly. Note the unit, quantity, location, and year beside the amount. The calculator gives a consistent ratio; the user still supplies the meaningful comparison.
Data coverage and update limits are part of the answer
The historical selector intentionally stops at 2025 because that is the latest annual-average CPI-U observation currently included in this calculator's local data. A later BLS release may exist before the page is updated, and a monthly CPI result is not the same thing as an annual average. Leaving the limit visible is more honest than silently presenting a newer-looking estimate without the matching data.
If a year is not available, use future mode only when an entered scenario is appropriate, or wait for the historical data to be updated. The source link in the Method and Sources section leads to the BLS historical annual-average table used for the series. If you spot a transcription, formula, wording, or accessibility issue, use Report an issue with the public year and value you are checking; do not send personal financial documents.
Do not turn an index conversion into investment advice
Inflation reduces the purchasing power of a fixed nominal amount under the assumed rate, but it does not determine which asset, account, loan, or spending decision is suitable for an individual. Risk tolerance, time horizon, liquidity, taxes, fees, debt costs, guarantees, and personal needs are not inputs here. The page does not recommend investing, borrowing, or changing a retirement plan.
A productive use is to document the assumption behind a goal. For example, keep a current-dollar target, the target year, the future-rate range, and the source of the historical comparison in one note. The Savings Goal Calculator can then show contributions under a separate stated growth assumption. Clear labels make conflicting assumptions easier to find.