
401(k) Calculator
Project a documented 401(k) scenario with an entered salary, contribution rate, employer-match formula, retirement age, and return assumption.
Example Scenarios
Career Starter
Age 30 • 8% • 100% to 4%
Full Match
4% to capture match
Missing Match
2% vs 4% cap • $80k
Catch-Up Years
Age 52 • 50% to 6%
401k Details View Results
401k Projection
Contribution Rate Comparison
Contributions, Match & Growth
Year-by-Year Projection
| Age | Salary | Employee | Match | Growth | Balance (headline) | Balance (other) |
|---|
How This Is Calculated
Each year your salary grows, employee contributions are capped at the IRS limit (with catch-up from age 50), employer match applies to contributions up to the match cap, and the balance compounds at your expected return. Inflation adjustment divides nominal balances by (1 + inflation)years.
Check the method before you use the estimate
This page documents the formula, assumptions, and any specific external sources used for this tool.
See the methodPlanning estimate What this result can and cannot tell you
This calculator is an educational projection, not financial advice, tax advice, legal advice, credit advice, investment advice, retirement-plan advice, or fiduciary advice. Investment returns are uncertain; consult plan documents and a qualified professional for decisions.
How the 401(k) Calculator works
These notes describe the calculation used on this page and the assumptions that can change a real-world result.
For each modeled year, employee contribution = the lower of salary x entered contribution percentage and the age-based employee limit. Employer match = the lower of employee contribution and salary x entered match cap, multiplied by the entered match rate. Ending balance = opening balance + opening balance x entered return + employee contribution + employer match.
Assumptions on this page
- For ages 60 through 63, the calculator assumes the plan permits the $11,250 higher 2026 catch-up. Confirm eligibility and contribution treatment in the actual plan documents before relying on that ceiling.
- The projection keeps those contribution limits fixed unless the calculator data changes; it does not forecast later IRS indexing, plan eligibility, Roth treatment, vesting, fees, withdrawals, loans, or employer-plan rules.
- Growth is applied once per modeled year to the opening balance. Real contributions, market returns, payroll timing, taxes, and fees occur on different schedules.
Sources used on this page
- IRS: 401(k) and profit-sharing plan contribution limits Used to check the 2026 employee elective-deferral limit and the age-based catch-up amounts represented in the calculator.
- IRS Revenue Procedure and Internal Revenue Bulletin 2025-49 Used as the published IRS reference for 2026 retirement-plan cost-of-living adjustments and the special higher catch-up range.
Everything behind the 401(k) Calculator
Formulas, reference charts, and detailed answers — expand any section you need.
A 401(k) ending balance is a scenario, not a forecast
A retirement projection can be useful when it reveals the assumptions behind a large future number. This page asks for a present balance, salary, contribution rate, employer-match formula, return assumption, salary-growth assumption, and retirement age. It then applies the same documented sequence each year. The result is a what-if scenario, not a prediction of a market return, retirement income, tax bill, or a recommendation to change an account.
Run more than one scenario. A lower return, a pause in contributions, a different retirement age, or a different employer-match rule can be more informative than one optimistic line. Keep the plan document next to the calculator inputs: the plan, not a generic web page, determines eligibility, compensation definitions, vesting, matching frequency, true-up provisions, Roth availability, and withdrawal rules. For a separate goal-oriented retirement estimate, see the Retirement Calculator.
Three layers are calculated separately
Employee contributions, employer match, and growth should not be collapsed into a single percentage. The page first calculates the employee amount from salary times the entered contribution percentage, subject to its annual employee limit. It then applies the employer formula to the eligible contribution amount. Finally, it applies the entered annual return to the opening balance for that year before adding the new employee and employer amounts.
For a simple one-year illustration, an $80,000 salary with a 4% employee contribution produces $3,200 of employee contributions. If the plan matches 100% up to 4% of pay, the entered formula adds a $3,200 employer match. Starting from a zero balance, the example has $6,400 of new contributions in the first modeled year. It says nothing about the investment performance after that year.
How the 2026 employee limit is represented
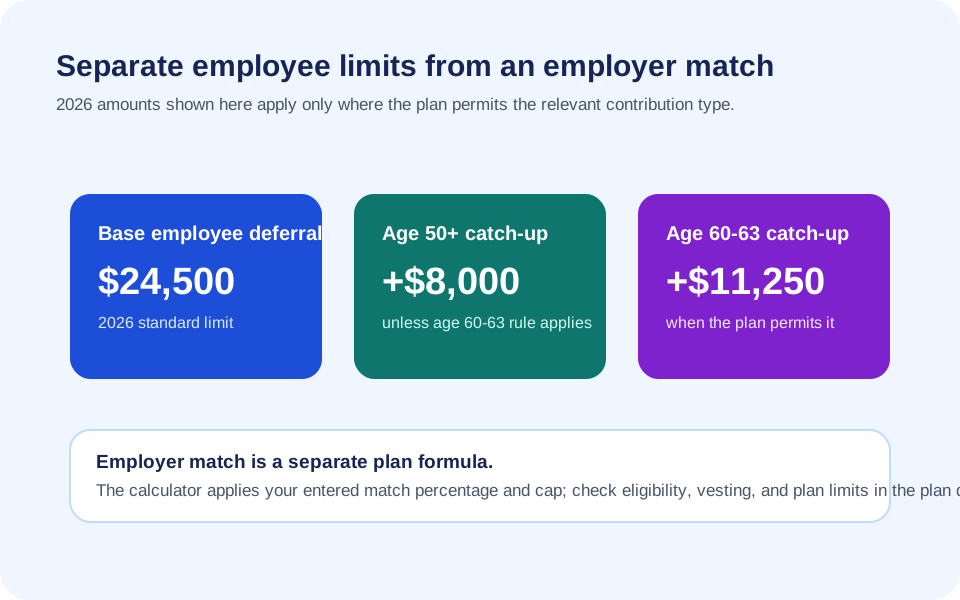
The calculator currently applies the 2026 employee elective-deferral amounts published by the IRS: $24,500 as the base limit, plus an $8,000 catch-up amount from age 50. For participants ages 60 through 63, it applies the higher $11,250 catch-up amount when the plan permits it. That creates modeled employee ceilings of $24,500, $32,500, or $35,750 depending on age and eligibility assumptions.
These values are a limit check within the page, not proof that a participant can contribute that amount. A plan can have eligibility and compensation rules, an employee can have contributions to another plan, and other annual limits can matter. The model also keeps the 2026 values fixed over future years rather than guessing how the IRS will index them. The IRS contribution-limits page should be checked when a real contribution decision is being made.
Read an employer match formula literally
A match formula has at least two moving parts: the percentage the employer matches and the employee contribution limit to which it applies. “100% up to 4%” means an employee contributing 4% of eligible pay can receive a match equal to 4% of eligible pay, subject to the plan. “50% up to 6%” means a 6% employee contribution can produce a 3% employer match. The same total employee contribution can therefore create a different match under a different plan formula.
Enter the match rate and cap from the plan's summary, and check whether the plan matches per payroll, annually, after a waiting period, or with a year-end true-up. This calculation does not know the answer. It also does not assume that receiving a match is universally the best next financial action; cash-flow needs, high-interest debt, emergency savings, eligibility, and personal goals are outside its scope.
The growth assumption is a label, not an expected result
The entered annual return is applied once per modeled year to the opening balance. That convention makes the math easy to inspect, but real markets do not return the same percentage each year. Contributions generally arrive throughout the year, investment choices can change, account fees can reduce results, and withdrawals or loans can interrupt compounding. Inflation also changes the future purchasing power of a balance.
Instead of asking which return is right, compare a small range and label it clearly. For example, a 4%, 6%, and 8% nominal-return scenario reveal the sensitivity of a long time horizon without implying any is promised. The Inflation Calculator can be used separately to see how an entered inflation rate changes a future amount's purchasing-power interpretation. It does not convert this page into a complete retirement-income plan.
Salary growth changes later contribution dollars
When contributions are a percentage of salary, a salary-growth assumption changes later deposits as well as the account balance. At a starting salary of $80,000 and a 3% annual salary-growth assumption, the model raises the salary used for later contribution and match calculations. It does not claim that the user will receive raises, bonuses, promotions, or uninterrupted employment.
Compare a zero-growth and a modest-growth input if future earnings are uncertain. If a contribution percentage would exceed the model's employee limit, the page caps the contribution at that limit. Because the limit is held at its 2026 amount, a long-range projection can understate or overstate future capacity depending on later law and plan changes. This is a reason to revisit inputs rather than treat a decades-long output as settled.
Connect the projection to present cash flow with care
A contribution changes present pay as well as a future balance. The US Paycheck Calculator can model a separate annualized paycheck scenario with an entered pre-tax contribution, while the Budget Calculator can show the cash-flow categories around it. Neither calculator knows your plan's tax treatment or tells you how to prioritize competing goals.
Use the page's Report an issue control for a reproducible formula, content, data, or accessibility issue. Include a non-sensitive age range, contribution percentage, and observed result if that helps reproduce the problem. Do not include account numbers, tax identifiers, employer portal access, or a full statement.