
ROI Calculator
Calculate total ROI and annualized ROI from the initial investment, additional costs, final value, income, and holding period you enter. The output is a comparison metric for supplied cash flows, not a forecast, valuation, tax calculation, or investment recommendation.
ROI Details
ROI Analysis
| Holding period | — |
Cost vs. Return
How This Is Calculated
Return on investment uses ROI = (Gain − Cost) / Cost × 100, with your own numbers plugged in:
Check the method before you use the estimate
This page documents the formula, assumptions, and any specific external sources used for this tool.
See the methodPlanning estimate What this result can and cannot tell you
Educational calculation only. This calculator does not value an asset, forecast investment performance, recommend a purchase, sale, project, campaign, property, financing, or allocation, and is not financial, tax, legal, real-estate, or investment advice. Verify every cash-flow input and applicable terms before acting. This is not financial advice.
How the ROI Calculator works
These notes describe the calculation used on this page and the assumptions that can change a real-world result.
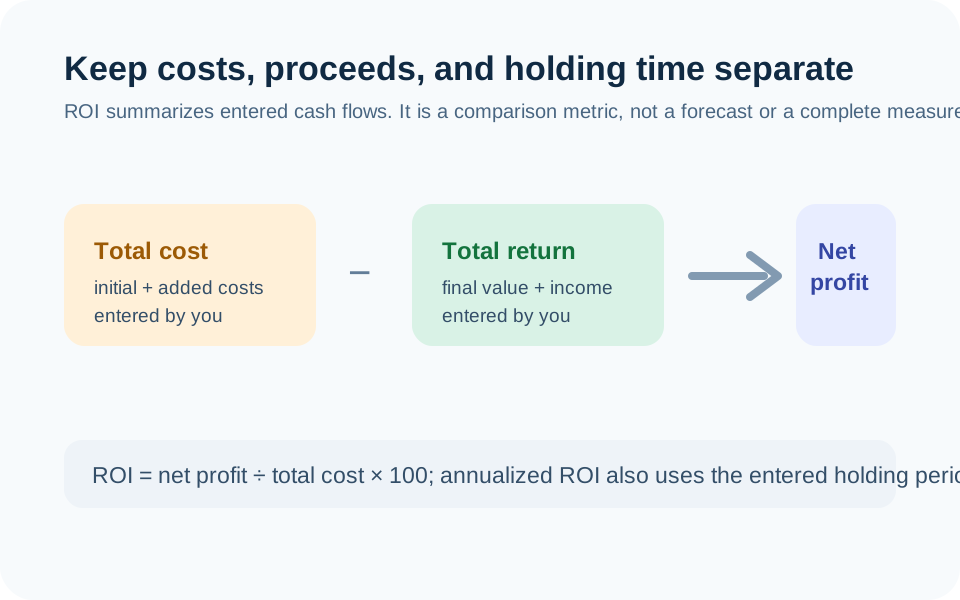
Total cost = initial investment + additional costs. Total return = final value + income received. Net profit = total return − total cost. ROI = (net profit ÷ total cost) × 100. Annualized ROI uses the entered holding period to convert the total return ratio to an annual rate.
Assumptions on this page
- Initial investment, additional costs, final value, income, holding period, and any real-estate or marketing inputs are user-entered values.
- All values should use the same cash-flow basis. The calculator does not decide whether figures are before or after taxes, financing, fees, depreciation, refunds, inflation, or other costs.
- Annualized ROI is a mathematical time normalization. It does not predict the next year’s return, measure volatility, or make two investments comparable when their risks and cash-flow definitions differ.
- The page does not verify valuations, sale prices, rents, expenses, campaign attribution, property conditions, financing terms, taxes, or legal obligations.
Sources used on this page
- U.S. Securities and Exchange Commission: Investor.gov Annual Return glossary Supports distinguishing a one-year return concept from a total return over another holding period; it does not establish a good or expected return.
Everything behind the ROI Calculator
Formulas, reference charts, and detailed answers — expand any section you need.
ROI is a ratio built from the cash flows you choose
Return on investment is most useful when the definition of cost and return is visible. This page adds the initial investment and additional costs you enter, then adds the final value and any income received. Net profit is total return minus total cost, and total ROI is net profit divided by total cost.
The percentage is not a verdict on whether an investment, project, campaign, or property is “good.” If the inputs omit financing, taxes, fees, maintenance, vacancy, labor, time, or risk, the ratio omits them too. Define the cash-flow basis before comparing two results.
Check the total ROI arithmetic with one small scenario
Suppose a scenario has $10,000 initial investment, $1,000 additional costs, $13,000 final value, and $500 of income. Total cost is $11,000; total return is $13,500; net profit is $2,500. Total ROI is $2,500 ÷ $11,000 × 100, or about 22.73%. That is the exact ratio for the figures supplied.
The holding period does not change that total ROI percentage. It does matter for annualized ROI, because the page uses time to convert a total return ratio into an annual-rate comparison. The diagram keeps those components separate so you can inspect the numerator and denominator before trusting a headline.
Annualized ROI answers a different comparison question
A 20% total ROI over one year and a 20% total ROI over five years are not the same time-based result. Annualized ROI applies the entered holding period to the total return ratio so that periods of different lengths can be compared mathematically. The U.S. Securities and Exchange Commission defines an annual return as a profit or loss over a one-year period; this page’s annualized view is a time-normalized calculation, not a claim that the same rate will repeat.
Use the actual time capital was committed. A partial year, delayed contribution, staged renovation, or intermittent campaign can make a single holding-period figure less representative. Record the dates and cash flows before comparing annualized results.
Real estate and marketing modes still need a complete input list
The real-estate mode groups purchase price, closing costs, renovation costs, sale price, rental income, monthly expenses, and holding period. It does not validate a property value, rent, repair budget, financing rate, tax, insurance, vacancy, maintenance, or transaction cost. Check whether income and expenses use the same time period and whether the sale amount is before or after selling costs.
The marketing mode groups spend, attributed revenue, profit margin, and campaign period. Attribution and margin assumptions are business-specific. The calculator cannot determine whether a revenue figure was caused by a campaign, whether overhead belongs in margin, or whether a promotion changed other sales. Use it to document the formula, not prove causation.
Compare like with like before using ROI
Two scenarios can have the same ROI and be materially different because of time, volatility, liquidity, leverage, tax, inflation, concentration, or the reliability of the final-value estimate. Add the same categories of costs and proceeds to each comparison or state what is excluded. An incomplete but consistently defined metric can still be useful; an inconsistent metric can mislead.
For a contribution-and-return scenario, use the Investment Calculator. For a simple interest or loan cost question, use the Interest Calculator or Loan Calculator. These calculations should not be merged without matching their time and cash-flow assumptions.
Make the cash-flow timeline part of every ROI comparison
A single beginning cost and ending value can hide important timing. A project may require several payments, earn income intermittently, or receive proceeds after a delay. If timing is material, keep a dated cash-flow list alongside the ROI result and state which amounts were included. The calculator’s holding-period input annualizes the total ratio; it does not perform a complete discounted-cash-flow analysis.
Also check whether borrowed money is being mixed with the project’s own cost. Leverage can change both the cash invested and the risks borne, so a leveraged ROI and an unleveraged ROI may not be comparable. Do not use one percentage to substitute for a valuation, due-diligence process, tax analysis, financing review, or assessment of downside risk.