
Rent vs Buy Calculator
Compare transparent rent and buy scenarios across a time horizon using your own housing costs, mortgage inputs, appreciation and rent-growth assumptions, sale costs, and an optional investment-return assumption. The page compares modeled net positions; it does not tell anyone what they should do.
Example Scenarios
$2,200 vs $450k
10% down • 7% • 10 yr
Starter Home
$1,800 rent • $320k
High Rent Market
$3,000 rent • 20% down
Short Stay
3-year horizon
Rent vs Buy Inputs View Results
Modeled Rent and Buy Comparison
Net Wealth Position Over Time
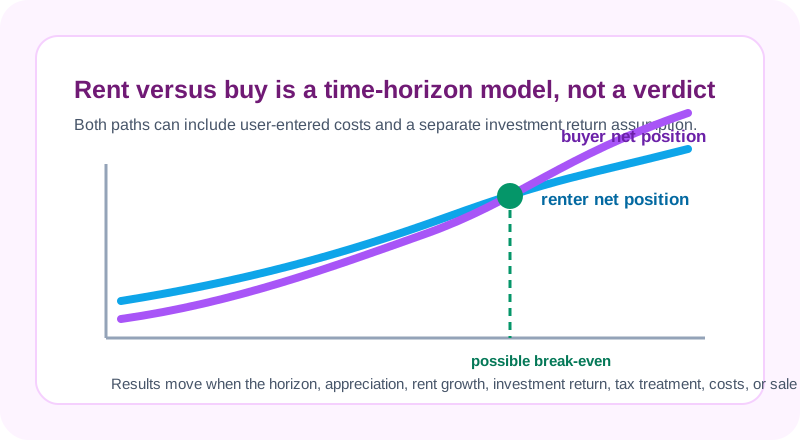
The lines show modeled net positions under the entered assumptions, including a modeled sale cost at each year. A crossing is a model result, not a recommendation or forecast.
Modeled Net Position by Time Horizon
Modeled net-position difference (buyer minus renter) at each horizon. Positive means the buyer position is higher in this scenario; negative means the renter position is higher.
Itemized Cost Stacks Over Horizon
How This Is Calculated
This scenario compares modeled net positions at every year. The renter model invests the buyer's up-front cash (down payment plus closing costs) and any monthly difference at the return you enter. The buyer model uses equity built through amortization and appreciation, net of modeled selling costs, plus any monthly difference. Break-even is the first modeled year in which the buyer net position reaches or exceeds the renter net position.
Check the method before you use the estimate
This page documents the formula, assumptions, and any specific external sources used for this tool.
See the methodPlanning estimate What this result can and cannot tell you
Educational rent-versus-buy scenario only. This is not financial advice, real-estate advice, tax advice, investment advice, or legal advice. Do not rely on it as a forecast of property values, rents, returns, costs, financing, or personal suitability; verify current terms and discuss important decisions with appropriate professionals.
How the Rent vs Buy Calculator works
These notes describe the calculation used on this page and the assumptions that can change a real-world result.
Buyer net position = buyer investment account + [home price * (1 + appreciation)^years - remaining mortgage balance - estimated selling costs]; renter net position = renter investment account. Both investment accounts grow monthly at the return entered and receive the modeled monthly cost difference.
Assumptions on this page
- Rent growth, appreciation, investment return, maintenance, insurance, taxes, HOA, closing costs, selling costs, and mortgage terms are entered by the visitor and can materially change the result.
- The buyer path uses a fixed-rate amortizing mortgage. The renter and buyer portfolios are mathematical accounts, not real accounts or forecasts.
- The optional mortgage-interest tax field is a simplified percentage applied to modeled interest. It does not determine eligibility, deductions, tax liability, or tax benefit.
- A horizon result and break-even year are scenario outputs, not a recommendation to rent, buy, invest, or move.
Sources used on this page
- CFPB: What are all the costs of buying a home? Used for the reminder that a home purchase includes borrowing costs, fees, and property-related costs beyond the listing price.
- CFPB: Ready to buy a home? Used for the reminder that ongoing taxes, insurance, repairs, moving costs, and other ownership responsibilities affect readiness.
Everything behind the Rent vs Buy Calculator
Formulas, reference charts, and detailed answers — expand any section you need.
Rent versus buy needs a time horizon, not a slogan
Renting and buying create different cash flows, different upfront costs, and different exit choices. This calculator compares them as two modeled net positions over the time horizon you enter. The renter path begins by investing the buyer's modeled upfront cash and adds any monthly cost difference when renting is cheaper. The buyer path combines home equity after a modeled sale cost with a separate investment account when buying is cheaper month to month.
That approach is more useful than comparing one rent payment with one mortgage payment because it forces the timing and costs into the open. It is still not a forecast or a verdict. Your move date, local market, actual rent, home condition, property taxes, insurance, financing, liquidity needs, and risk tolerance can make a real decision differ from this scenario.
What the two modeled net positions contain
For buying, the page calculates principal and interest from the selected mortgage, then adds property tax, insurance, HOA, maintenance, and a simplified optional tax field. At the chosen horizon, it projects a home value using the appreciation assumption, subtracts the modeled remaining mortgage balance and selling cost, and adds any buyer-side investment account.
For renting, the page models rent growth and renters insurance. The renter's portfolio begins with the down payment plus closing costs that the buyer would have paid, and receives the monthly difference whenever renter costs are lower. Both portfolios grow monthly at the investment-return input. The comparison is only as reliable as those assumptions, so every one is editable.
Worked scenario: separate the upfront-cash opportunity from the house model
Consider a $300,000 purchase with a $60,000 down payment and 3% modeled closing costs. The buyer's upfront cash is $69,000. If a renter instead starts with $69,000 and the scenario assumes a 5% annual investment return compounded monthly, that starting amount grows to about $88,071 after five years before any monthly cost differences are added. The calculation is $69,000 × 1.055.
The buyer side needs separate inputs: mortgage balance, property tax, insurance, maintenance, appreciation, and eventual selling cost. The example does not claim that either path will produce that return or that the property will appreciate. It shows why a comparison should not quietly discard the down payment, closing costs, or the selected time horizon.
Ownership costs should be explicit, including the exit
Listing price and mortgage principal-and-interest are only part of a buy scenario. This page provides fields for property tax, insurance, HOA, maintenance, closing costs, and selling costs so they can be inspected one by one. The CFPB's home-buying cost overview similarly emphasizes that borrowing costs, fees, and property-related costs matter beyond the listing price.
The calculator cannot know the actual inspection findings, repairs, special assessments, local taxes, insurance changes, landlord responsibilities, moving costs, utility differences, or sale transaction details. Replace default-looking fields with sourceable local estimates and rerun the horizon when those facts change.
Growth and tax assumptions are sensitivity inputs
Home appreciation, rent growth, and investment return are powerful because they compound over time. They are also uncertain. Entering a higher value can make either path look better without proving it will happen. The most honest use of the page is to run conservative, middle, and adverse assumptions over a horizon that matches your likely plan, then see whether the conclusion flips easily.
The optional mortgage-interest tax field is especially limited. It applies a user-entered percentage to modeled mortgage interest. It does not establish whether a household itemizes, qualifies for a deduction, has a taxable benefit, or faces a jurisdiction-specific rule. Leave it at zero if you do not have a confirmed reason to model it, and seek tax guidance for an actual filing question.
Make the comparison auditable
- Pick a time horizon based on your real flexibility and likely move timing, not the result you hope to see.
- Enter rent and ownership costs from current local records or quotes.
- Write down the source and date for appreciation, rent-growth, and return assumptions.
- Run the same scenario with lower appreciation and investment-return assumptions and higher ownership costs.
- Use the Home Affordability Calculator and Mortgage Calculator for their separate budgeting and payment checks.
Report unclear math or wording through the page's issue form using non-sensitive sample numbers. Do not include an address, tax return, account details, or private offer.