
Investment Calculator
Project a hypothetical balance from the starting amount, recurring contribution, time horizon, return, compounding, contribution-increase, and inflation inputs you choose. The result is a scenario calculation, not an investment forecast or recommendation.
Example Scenarios
Index Fund Plan
$10k + $500/mo • 7% • 25 yr
$500 Monthly
$500/mo • 7% • 30 yr
Path to $1M
$1k/mo • target $1M
Rising Contributions
$300/mo + 3%/yr raises
Investment Details View Results
Investment Projection
Return Sensitivity
Contributions vs Growth
Year-by-Year Breakdown
| Year | Contributions | Growth | End (headline) | End (other) |
|---|
How This Is Calculated
The projection compounds your starting amount and monthly contributions month by month at your expected return, with optional annual raises on the deposit. Inflation adjustment divides nominal balances by (1 + inflation)years to show today's purchasing power.
Check the method before you use the estimate
This page documents the formula, assumptions, and any specific external sources used for this tool.
See the methodPlanning estimate What this result can and cannot tell you
Educational projection only. This calculator does not predict investment performance, recommend a security or allocation, account type, contribution amount, or withdrawal strategy, or provide financial, tax, or investment advice. Verify account terms and obtain qualified advice where appropriate. This is not financial advice.
How the Investment Calculator works
These notes describe the calculation used on this page and the assumptions that can change a real-world result.
The calculator grows the entered starting balance and contributions through successive periods using the entered annual return and selected compounding frequency. It can increase the recurring contribution annually and divides nominal balances by (1 + entered inflation rate) raised to elapsed years for the purchasing-power view.
Assumptions on this page
- Starting balance, monthly contribution, contribution increase, time, return, compounding frequency, target, and inflation rate are user-entered scenario inputs.
- The return is an assumed constant rate within a scenario. Actual investments can gain or lose value and do not earn a fixed return merely because one is entered here.
- The inflation adjustment is a mathematical purchasing-power comparison, not a forecast of future consumer prices or an individual cost-of-living estimate.
- The projection excludes investment fees, taxes, trading costs, contribution limits, account rules, changing asset allocation, deposits missed, withdrawals, and sequence-of-returns risk unless separately reflected in inputs.
Sources used on this page
- U.S. Securities and Exchange Commission: Investor.gov Compound Interest Calculator Supports using a starting amount, contribution, time, estimated rate, variance range, and compounding frequency as explicit scenario inputs rather than as a prediction.
- U.S. Securities and Exchange Commission: Investor.gov Free Financial Planning Tools Supports the use of separate compound-interest and savings-goal planning tools; it does not endorse a return assumption or investment choice.
Everything behind the Investment Calculator
Formulas, reference charts, and detailed answers — expand any section you need.
A projection is a chain of assumptions, not a forecast
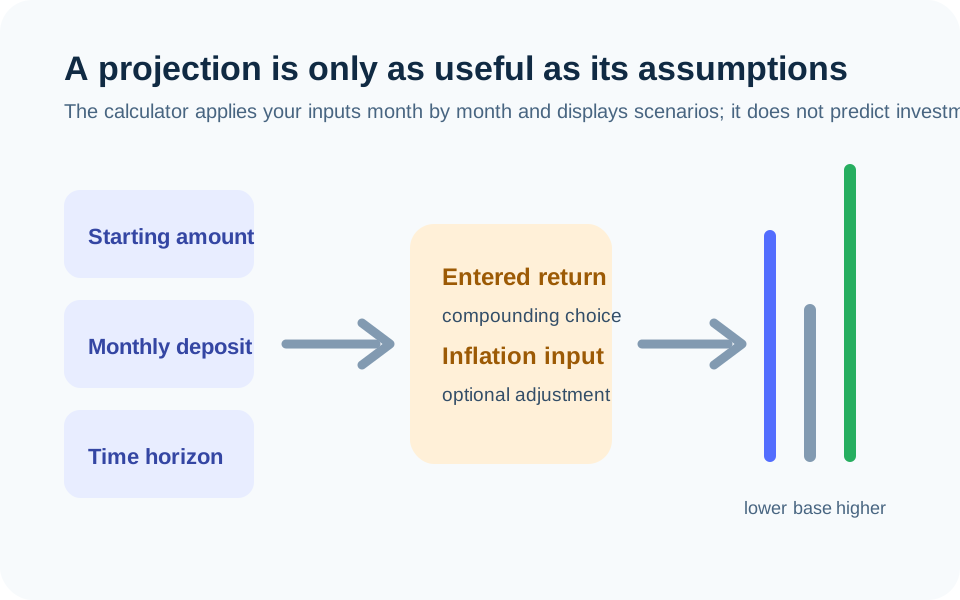
This calculator takes a starting amount, a recurring contribution, a time horizon, an assumed annual return, and a compounding choice, then repeats the growth arithmetic over time. You can also enter an annual increase in the contribution and an inflation assumption. The output answers a narrow question: what does this set of assumptions produce?
It cannot answer what a market, fund, account, or portfolio will actually do. A constant return input is a modeling convenience. Real investment values can rise or fall; costs, taxes, missed contributions, withdrawals, and account rules can change an outcome. Use the page to compare transparent scenarios, not to turn a chosen percentage into a promise.
Read the calculation one period at a time
In each modeled period, the starting balance earns the rate implied by the annual return and selected compounding frequency, and the page adds the contribution according to the selected timing. If you choose a contribution increase, the next year’s monthly contribution is raised by that percentage. The table separates the total amount you contributed from the modeled growth so you can see which part comes from each input.
For a simple scenario, a $10,000 starting amount plus $500 each month is not the same calculation as $10,000 with no future deposits. A long horizon makes the timing of deposits relevant, and a different compounding setting changes the assumed periodic rate. The diagram identifies the inputs that should be reviewed before you compare outputs.
Use sensitivity instead of pretending one rate is certain
The lower, base, and higher return rows are deliberately not recommendations. They show how the same contribution plan changes when the assumed return changes. That makes the model more useful than hiding uncertainty behind a single default. If a goal only works in the highest displayed scenario, that is information about the assumption—not evidence that the outcome will occur.
The U.S. Securities and Exchange Commission’s Investor.gov compound-interest tool similarly asks for an estimated rate, contribution, time, variance range, and compounding frequency. Those inputs belong in the open because they drive the result.
Nominal balance and purchasing power answer different questions
A nominal projection shows the model’s dollar amount at the end of the selected period. When you turn on the inflation adjustment, the page divides that future nominal amount by the entered inflation factor to express it in today’s purchasing-power terms. Both outputs can be useful, but neither is a prediction of prices or a guarantee of what a future withdrawal can buy.
Try a controlled comparison: keep the starting amount, contribution, time, and return unchanged; change only the inflation input; then inspect the nominal and purchasing-power columns. The Inflation Calculator is a separate historical-data tool and should not be used to turn one past index series into a future certainty.
Separate an investment projection from a savings deadline
Use this page when you want to inspect growth with a chosen return assumption and regular contributions. Use the Savings Goal Calculator when the main question is a cash goal, deadline, deposit amount, and account rate. Use the Retirement Calculator when the inputs include retirement spending, age, other income, withdrawal rate, and a separate retirement-period assumption.
Each tool is a different model. Copying a result from one to another without matching the assumptions can make a plan look more precise than it is. Record the date you ran a scenario and the actual inputs used, especially if you later compare it with a different contribution or time horizon.
Keep a scenario record instead of a single headline balance
When comparing two projections, write down the date, starting balance, monthly contribution, contribution increase, years, return assumption, compounding choice, and inflation setting for each one. A final balance without that input record cannot be reproduced or meaningfully compared later. This is especially important when a contribution is expected to change or when a target is evaluated under several return assumptions.
Do not use a projection to hide cash-flow risk. A contribution that only works if income arrives every month is a different scenario from a flexible contribution that can pause. The calculator can illustrate either input pattern only through reruns; it cannot estimate job stability, emergency costs, taxes, account limits, or the effect of withdrawals on a real portfolio.